 |
|
|
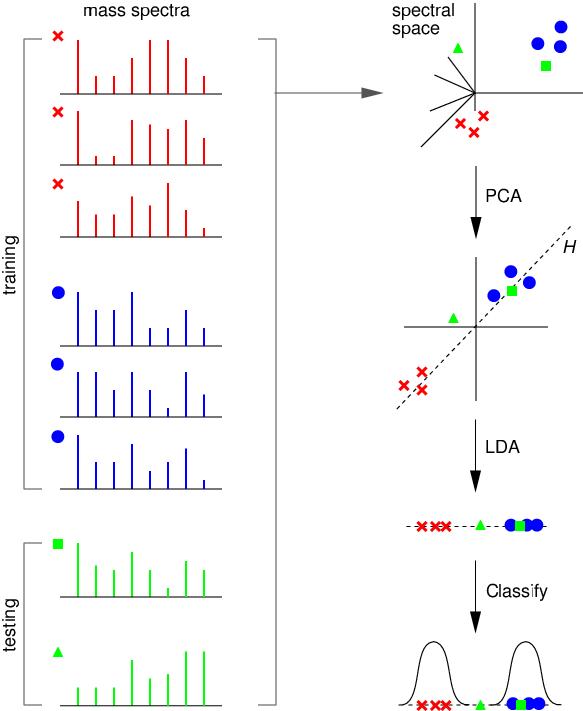
Major Steps of the Q5 Algorithm. The steps involved in building a two-class classifier are illustrated using simplified artificial spectra. On the left are training (red, blue) and testing (green) spectra. Shown on the right, from top to bottom, are (1) the spectral space representation of each spectrum; (2) PCA: the result of dimensionality reduction (for simplicity we show the projection onto just the top two principle components); (3) LDA: the projection of each spectrum onto the discriminant surface H; and (4) the probabilistic classification. In this example the testing spectrum denoted by the green square is classified as belonging to the class denoted by blue circles, while the spectrum denoted by the green triangle is unclassified. |
|